Designed Data Graphs
Illustration • Research • Data Interpretation
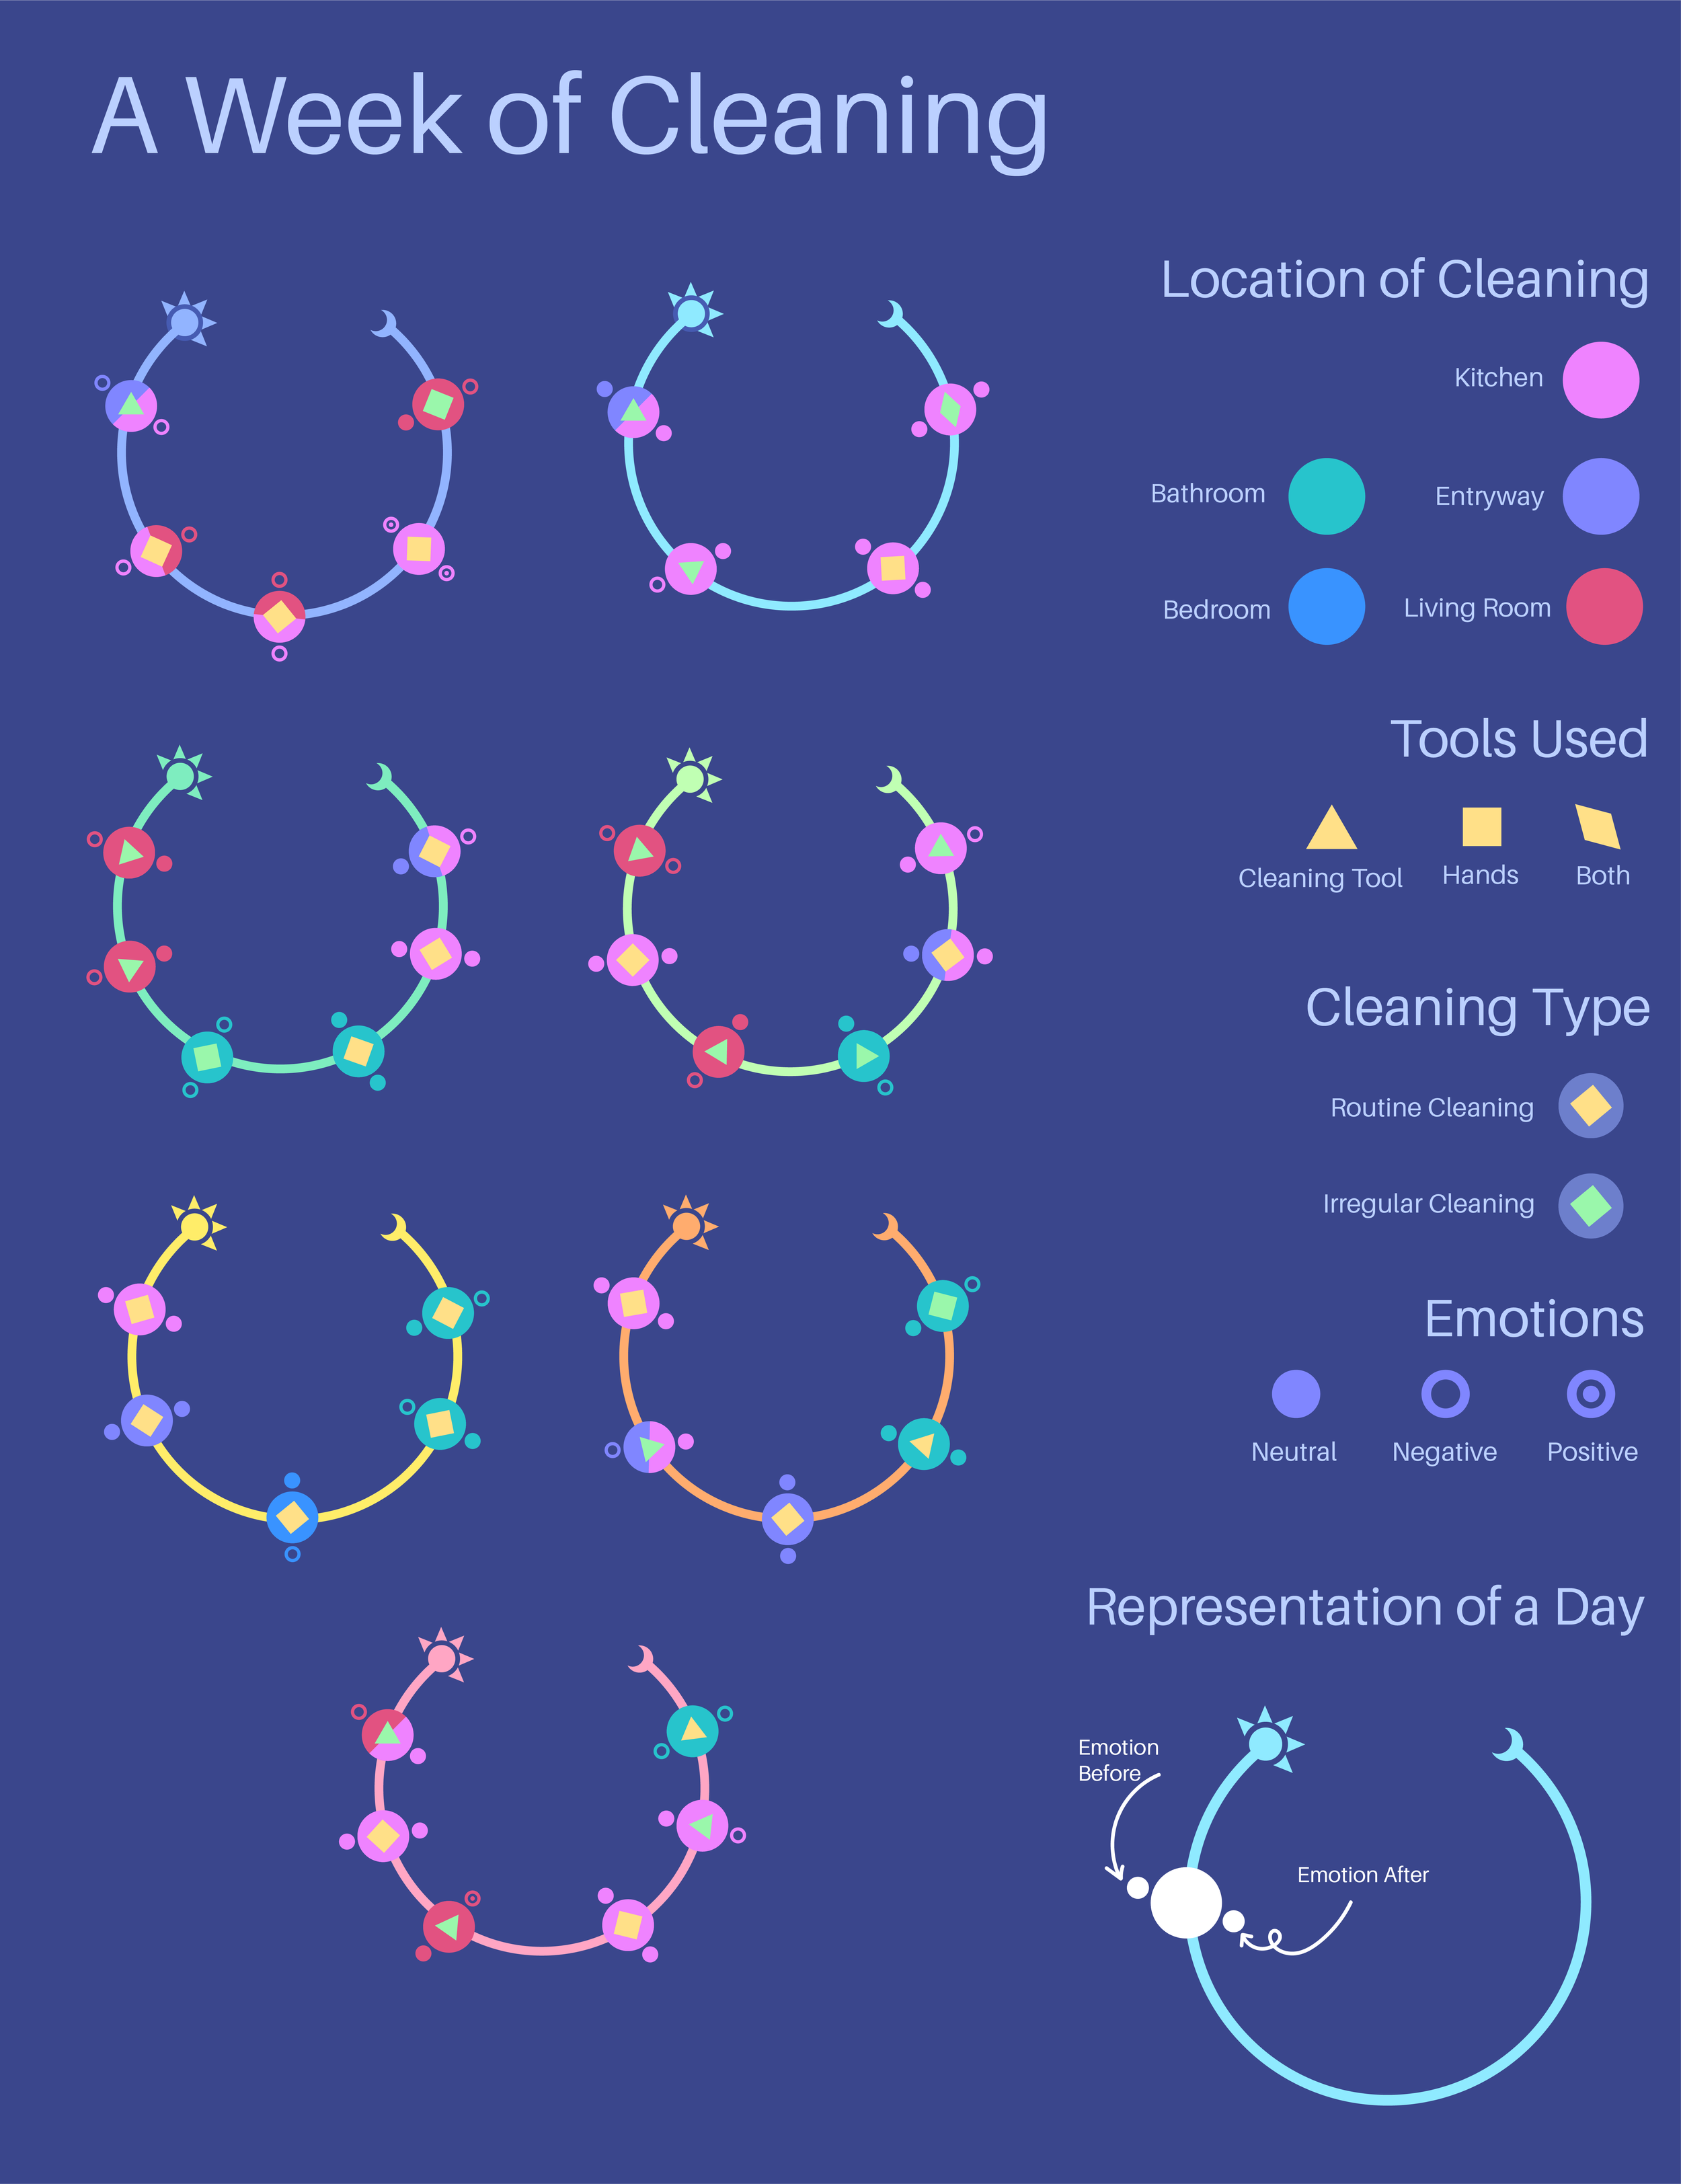
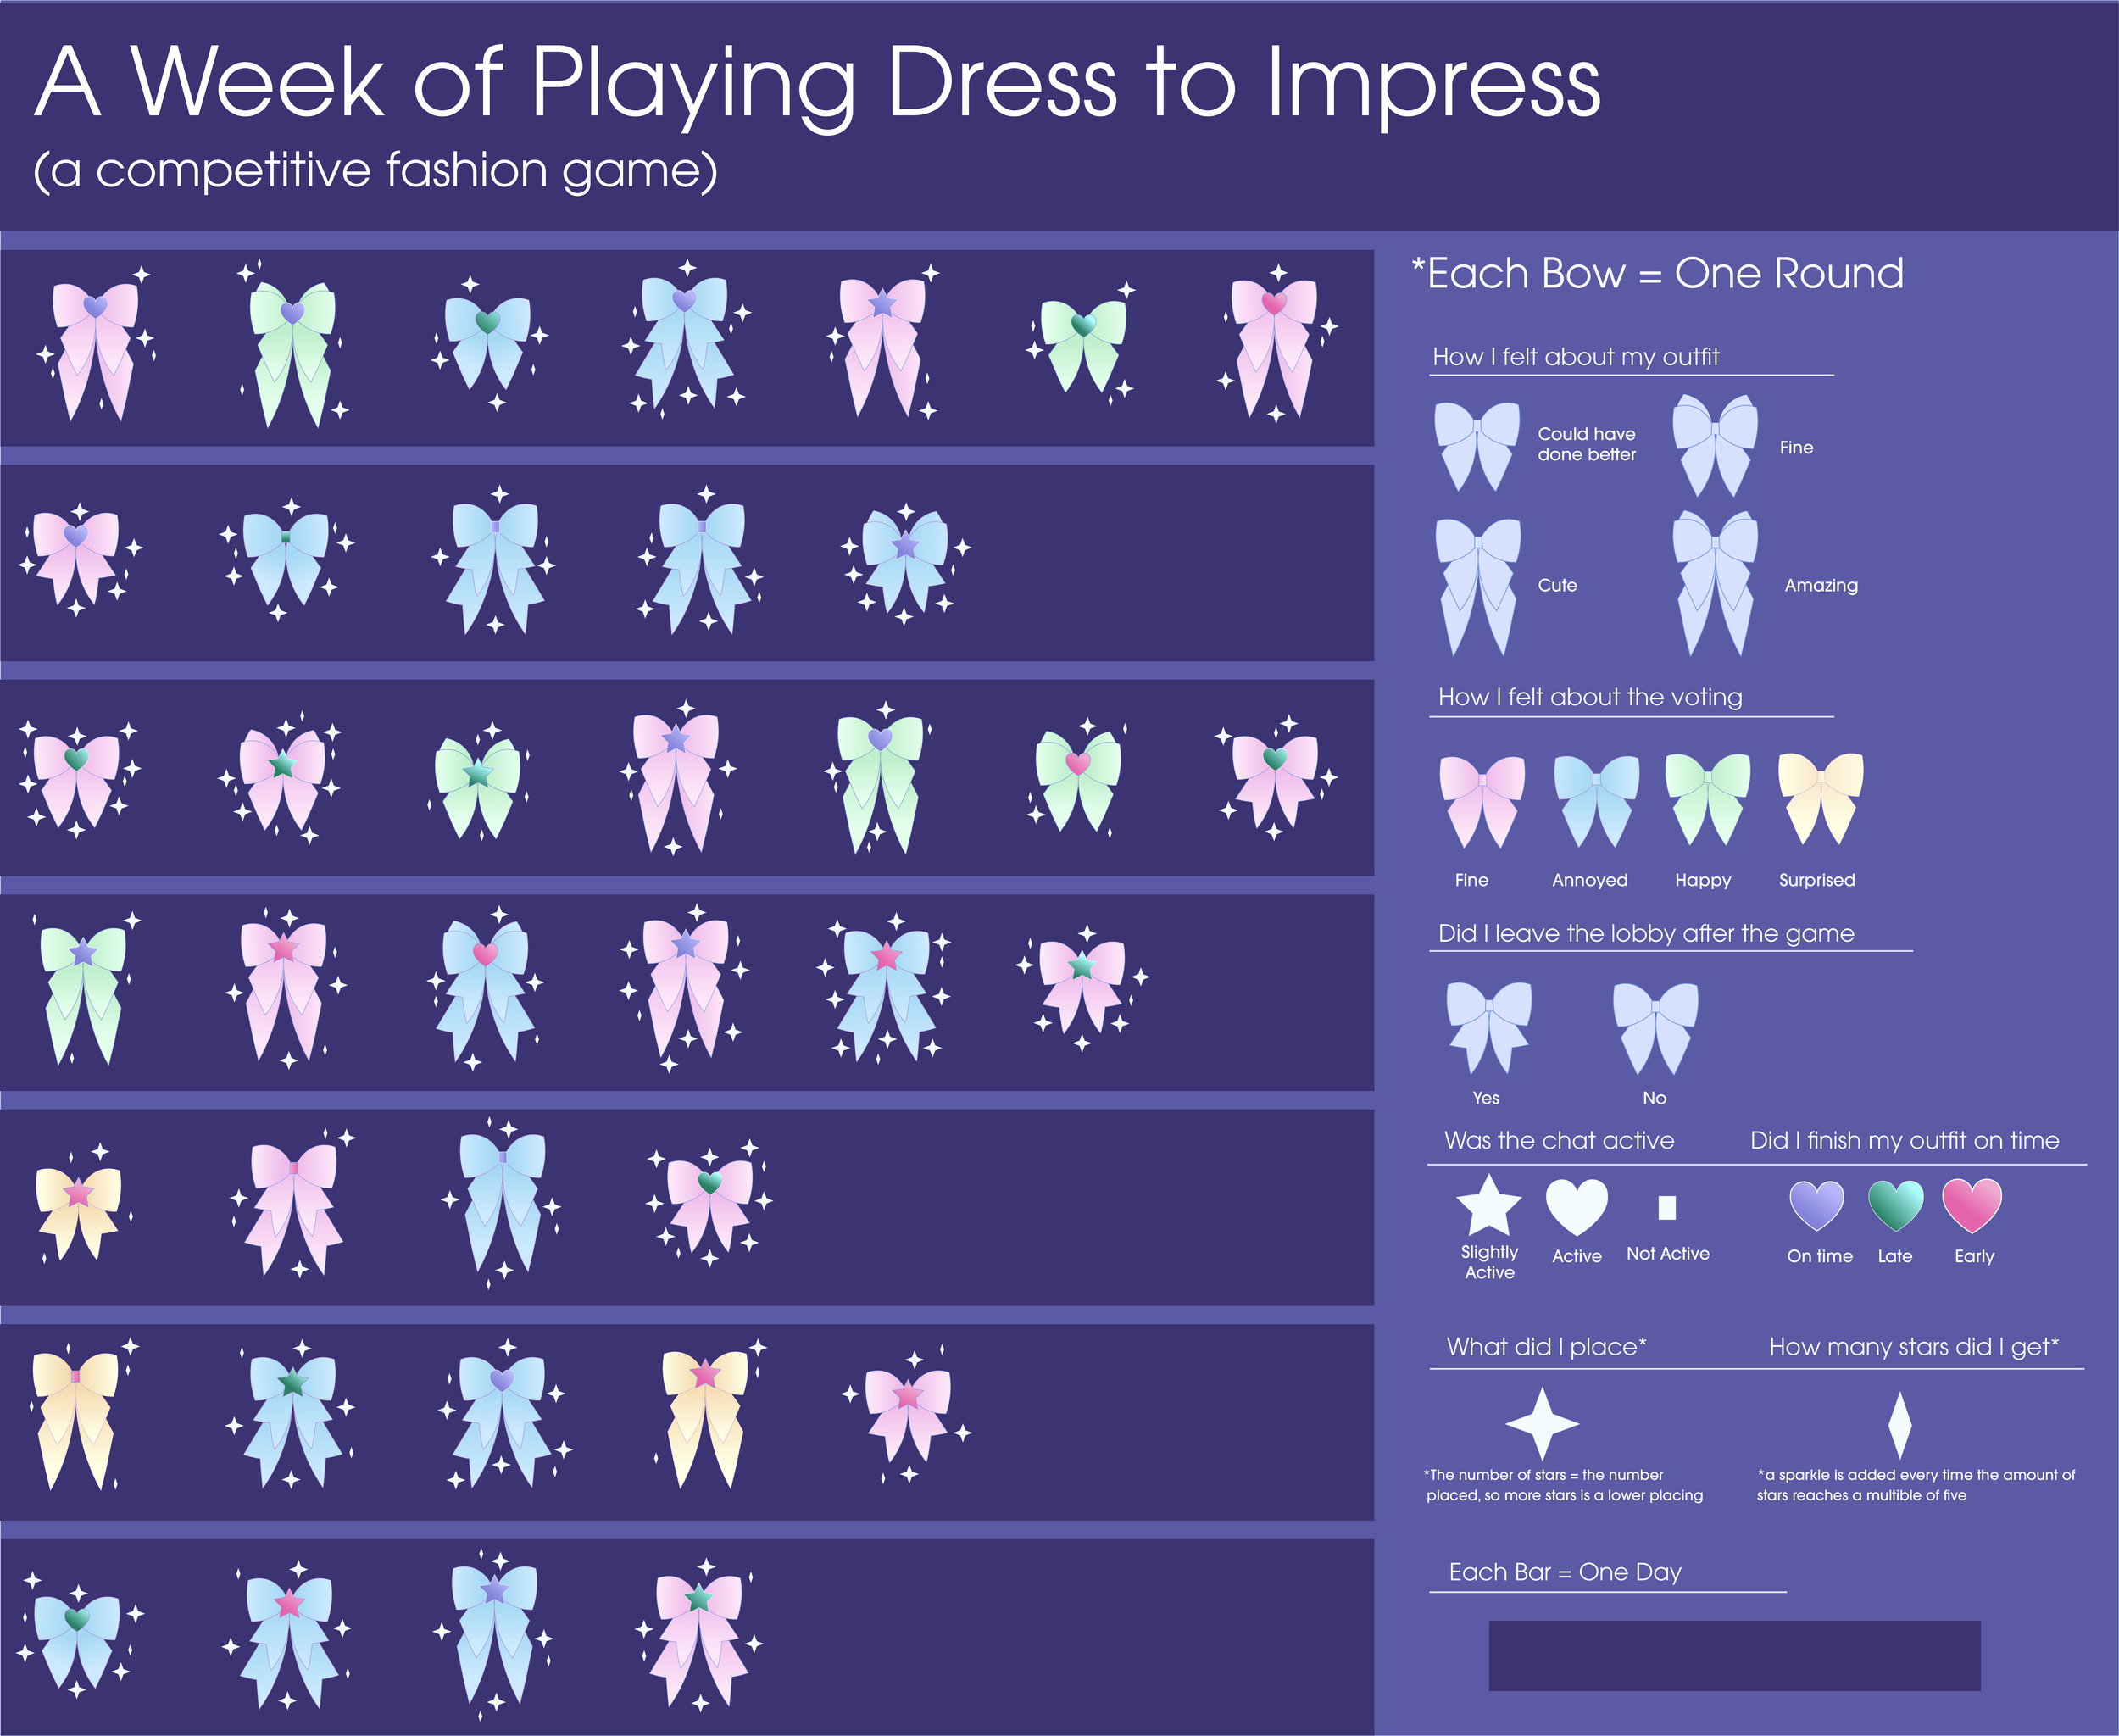
This project was a bit different for me as it required me to both collect data and then use my design skills to interpret it into a visual. It helped me think about how design can interpret data or anything else for the viewer. I now have a greater understanding of the responsibility we have as designers to portray things in an accurate way. The project let me take raw data and turn it into a design, which made me focus on viewer interpretation. I worked to create a perfect combination of an interesting design, while also making the data readable by the viewer.